GyeongBae Jeon | Data Analyst
/
프로젝트 (1)
Share
프로젝트 (1)
[Summary]
Insights
Solutions
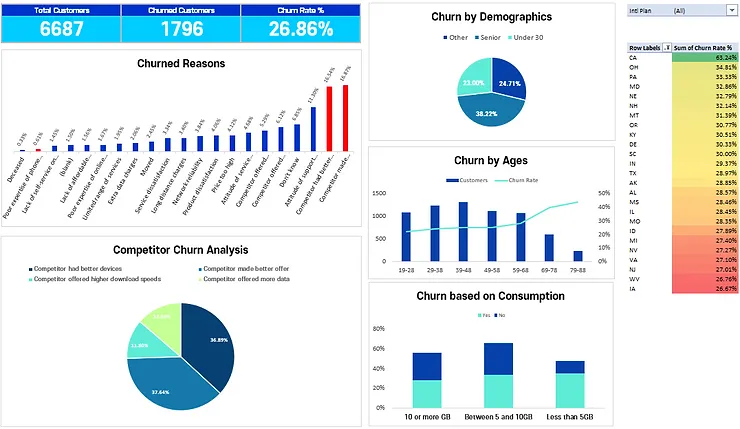
26.86% of the customers are churned.
Alert the issues of 26.86% of churn rate among the companies and conduct critical strategy analysis upon all departments: marketing, tech, services, policies, customer services • Check whether the departments are fulfilling the KPIs and discover the room of improvement. • Develop multiple strategies such as retooling the whole underperforming department
Customers are majorly leaving because of competitors. • The competitors tended to provide better devices and offers.
Initiate comprehensive competitor analysis and draft action plan based upon it.
The seniors had the highest churn rate among the age groups.
Conduct surveys or design 1 on 1 interviews with seniors and find the pain points of Databel's service compared to competitors
Having unlimited data plan and using less than 5GB have positive relationship of churn rate.
Calculate first whether dropping remedies to those who have unlimited plan but use less than 5GB will potentially decrease the churn rate and bring more profits.
California recorded extraordinary amount of churn rate if customers have international activity.
Consider providing exclusive customer assistance to those who are using international plan in California and investigate underlying reasons of higher churn rate compared to other states.
Introduction:
•
This case study is done upon the customer data of Databel, a telecom company in US.
•
The objective is to analyze the churn rate of Databel's customers, deliver extracted insights, and propose following solutions to the managers.
Customer Churn Rate Analysis
Excel
Churn Rate
Data Analysis
[Summary]
Sections
Key Points
Problem Definition
Importance of customer segmentation; the challenges in deploying proper models.
EDA
- Feature engineering (e.g., grouping ages, marital status, expenses). - Dropping outliers for clearer insights. - Positive correlation between income and expenses.
Proposed Model
- Elbow plot suggested K=3 clusters, but Gaussian Mixture Model (GMM) with K=5 was selected. - Achieved detailed segmentation with an acceptable silhouette score of 0.1342.
Cluster Details
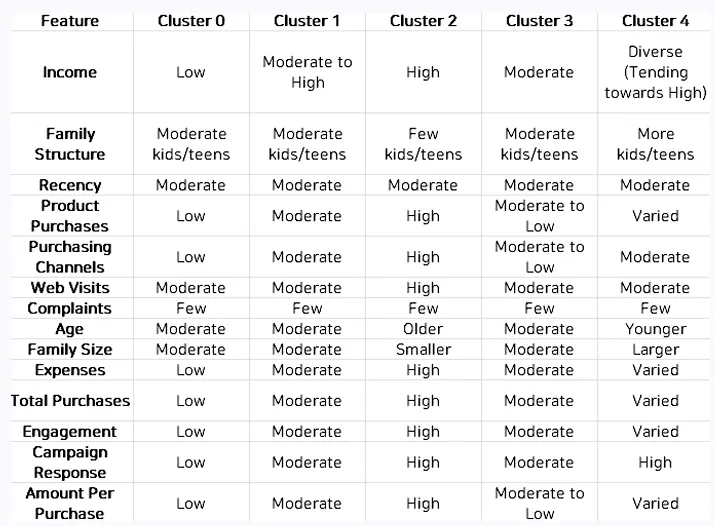
- Cluster 0: Low-income, low spenders; minimal engagement. - Cluster 1: Moderate income and spending; family-oriented. - Cluster 2: High-income, high spenders; highly engaged. - Cluster 3: Moderate income; conservative spenders. - Cluster 4: Diverse income and engagement; larger family sizes.
Business Solutions
- Cluster 0: Discount coupons, bulk purchase offers. - Cluster 1: Buy-now-pay-later, family campaigns. - Cluster 2: Premium offers, VIP loyalty programs. - Cluster 3: Cashback events, essential bundles. - Cluster 4: Household deals, segmented campaigns.
Introduction:
•
Identifying distinct customer segments within a heterogeneous customer base was the primary challenge, which would enable the implementation of more targeted and effective marketing strategies.
Context:
•
A company requested a robust model to segment customers based on their behavioral and demographic characteristics, ensuring that marketing efforts could be precisely aligned with customer needs and preferences.
Marketing Campaign Customer Segmentation
Data Analysis
Python
Statistics
Summary:
Overall, the advanced excel visualization tools are touched in this project and used accordingly.
Introduction:
•
This project was initiated in an attempt to upscale the level of data visualization skills in Excel
•
The objective is to provide advanced data visualization dashboard of customer data from a company operating in US using Pivot Table, Pivot Chart, and VBA.
Dataset:
Delivery App Customer Segmentation
Excel
Visualization
•
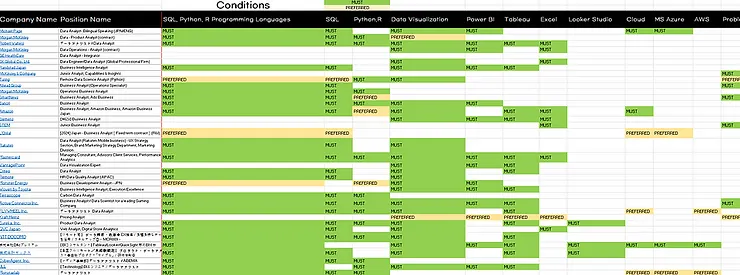
I collected and analyzed
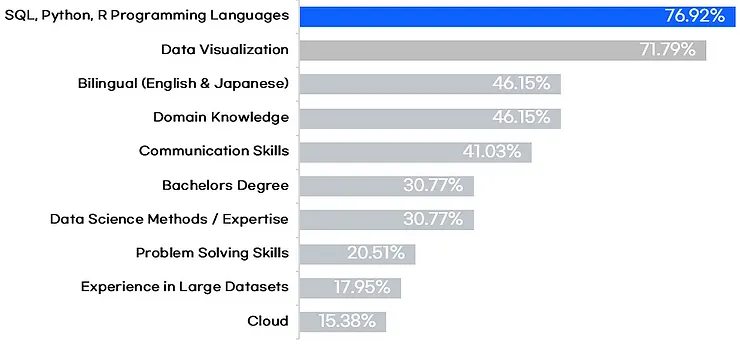
39 current Data & Business Analyst job recruitment posts
for personal excel data analysis project. I especially collected the data from international companies rather than completely local ones.
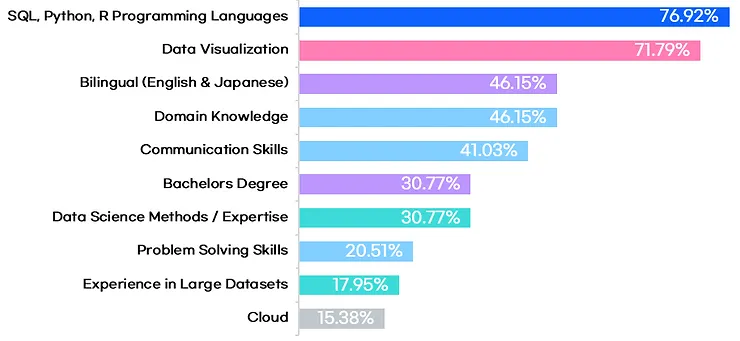
Top 10 Skills required to work in international companies as data analyst:
Learning programming languages like SQL, Python, and R is super important
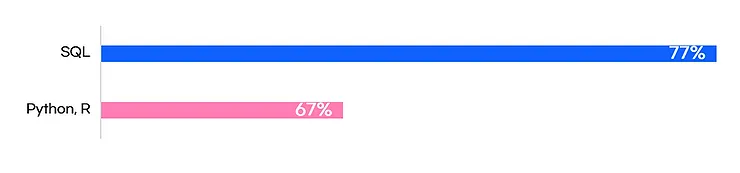
SQL is required more often than Python or R; therefore, it will be important for me to prioritize mastering SQL first.
Top Skills required for Data & Business Analyst in Tokyo
Excel
Data Analysis
Visualization
Summary:
Objectives:
•
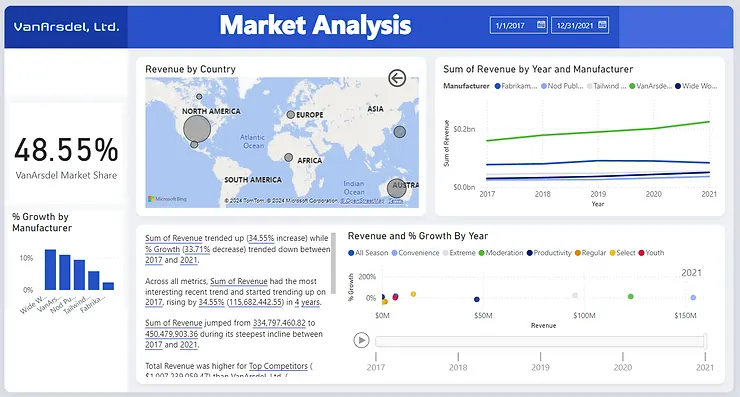
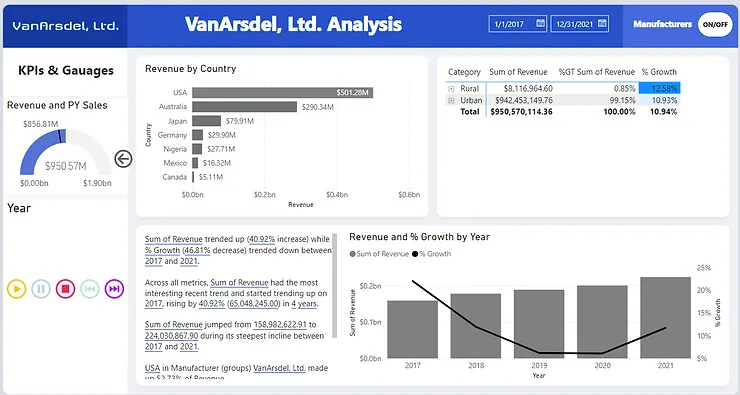
This case study is done upon analyzing dataset of VanArsdel and its competitors.
•
The datasets include:
1. Sales-dataset
Analyzing a company’s market competitiveness
Power BI
Data Analysis
Visualization