Summary:
Insights | Solution |
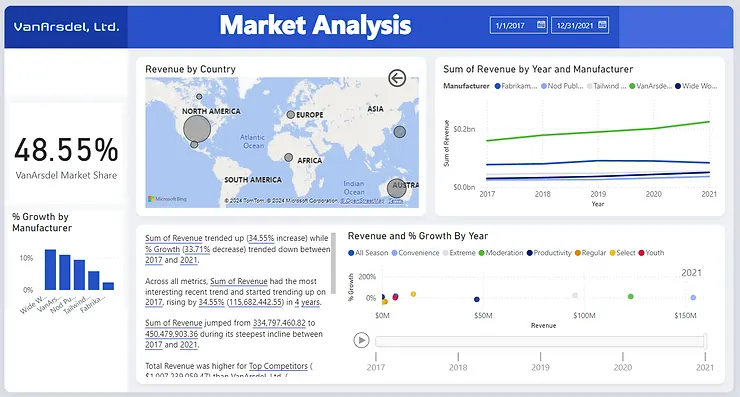
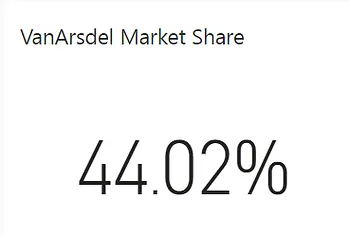
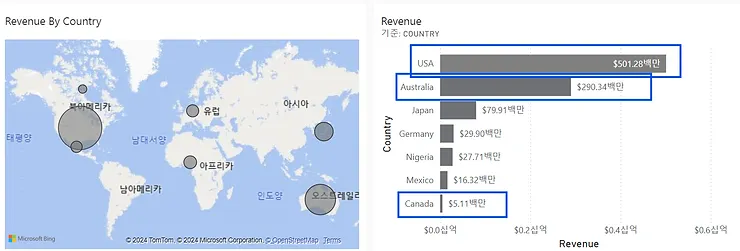
VanArsdel comprises over 48.55% over the market (almost by half) | While it is taking the largest proportion of revenues across the world, the market in Canada is not dominant($5M and competitors are around $1-2M). As the country has more potential, VanArsdel may need to consider the localized strategies to upscale its sales in Canada. |
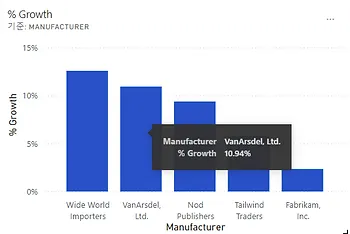
VanArsdel recorded an average of 10.94% growth throughout 2017 ~ 2021 | VanArsdal's one of top competitor 'Wide World Importer' recorded the highest growth of 12.59%. VanArsdal will have to further check in which areas the growth is lagging and make relative strategies. |
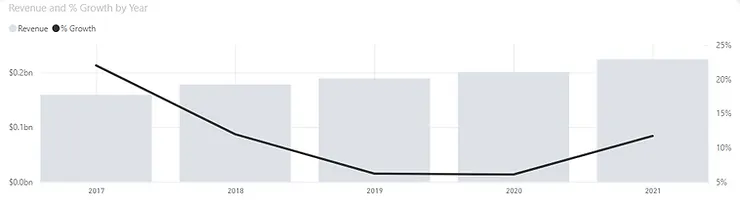
The revenue has been consistently growing but there is high fluctuation of growth going through a high trended down during 2019 - 2020 and displaying steepest incline most likely from COVID. | VanArsdal will have to check whether the growth rate is in the state of stagnation or not. The given data shows that the growth rate recovered back to 2018 which is before COVID happened. |
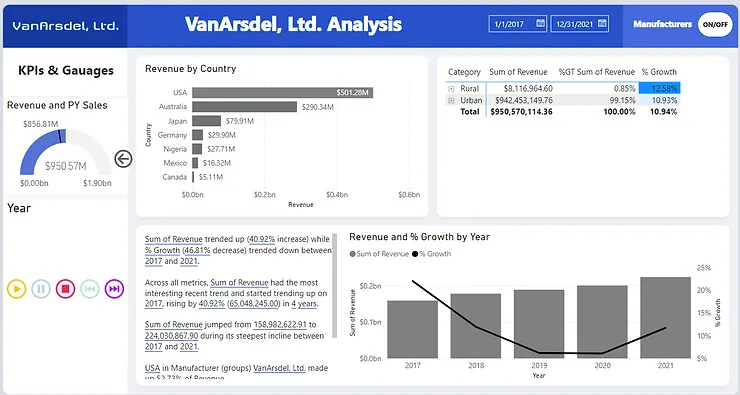
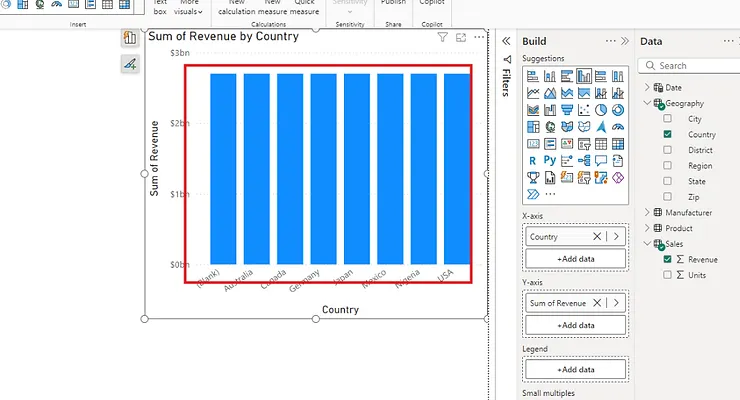
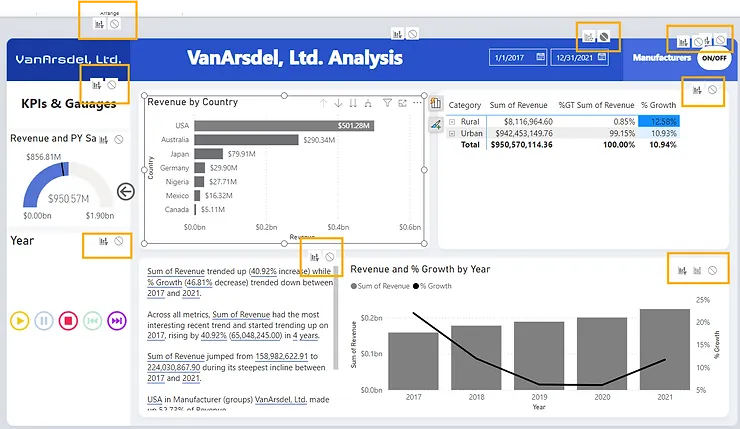
The largest proportion of the sales come from USA and Australia.
The market in USA made up 52.73% of revenue ($500M).
The least profit was made in Canada. | |
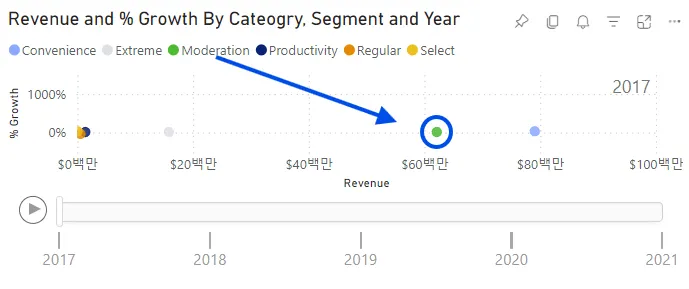
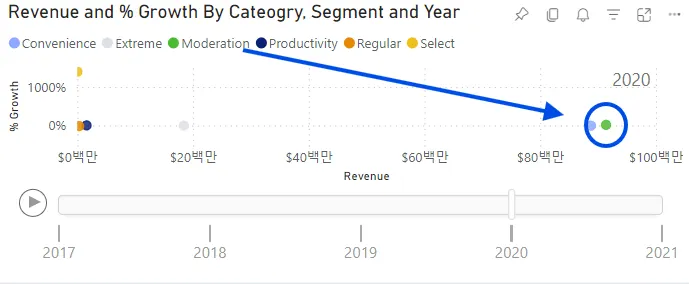
Moderation Product Segment grew significantly from 2017 to 2021 ($62M - $98M).
| However, there were other product segments that did not growth as much. On the other hand, the extreme product segment of 'Wide World Importer' grew significantly, which VanArsdel should be alerted with this and check the rationale behind. |
Objectives:
•
This case study is done upon analyzing dataset of VanArsdel and its competitors.
•
The datasets include:
1. Sales-dataset
>Revenue
>Units
2. Products-dataset
>Category
>Currency
>Manufacturer ID
>Product Name
>Product Costs
>Product ID
>Segment
3. Manufacturer-dataset:
>Logo
>Manufacturer
>Manufacturer ID
4. Geography:
>Country
>State
>City
>Region
>Zip
5. Date-dataset:
>Year
>Quarter
>Month
>Day
Context:
"VanArsdel manufactures expensive electronic products that can be used for fun as well as work.
They sell them directly to consumers nationwide in the USA as well as several other countries.
VanArsdel and its competitors have retained a third-party marketing company to collect and anonymize industry sales so that all participants can benchmark themselves."
Exploratory Data Analysis:
Data Cleaning:
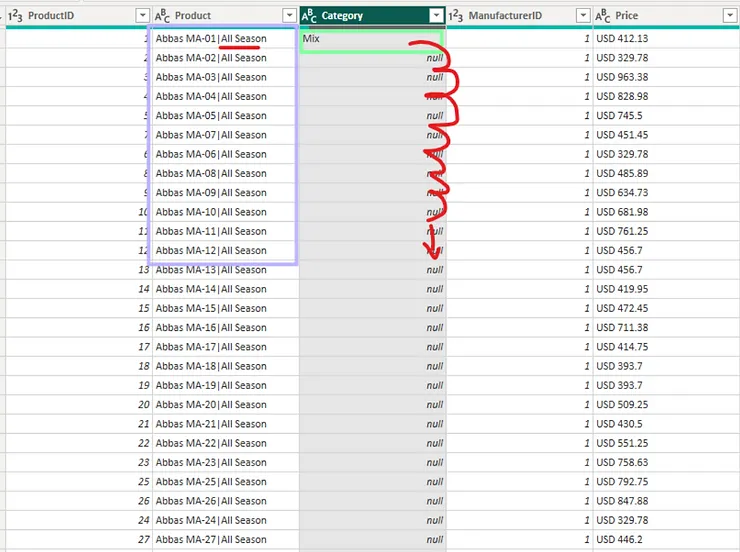
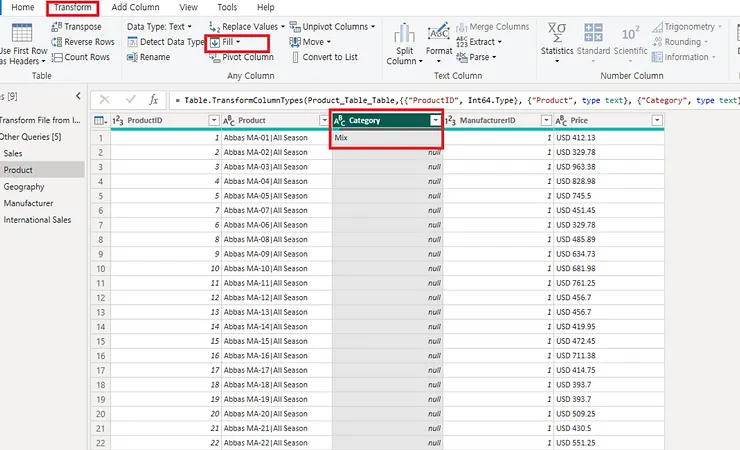
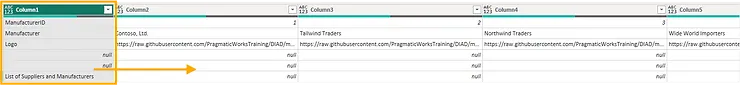
How to replace 'null' values with the values I want?
[Transform] > [Fill] > [Down]
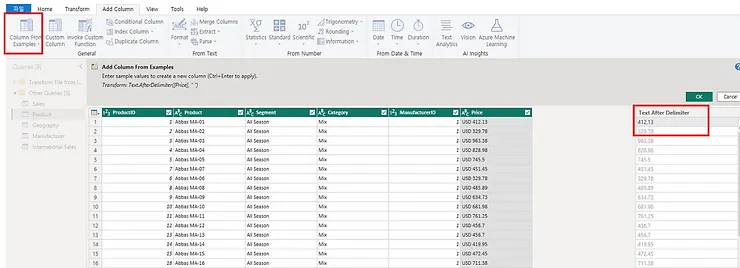
How to split columns easily?
Either use [Split Columns] or [Columns From Example]
[Transpose] dataset organized in this way
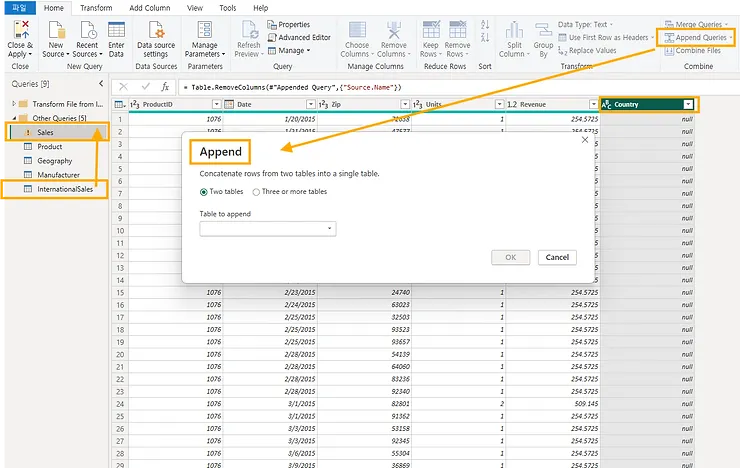
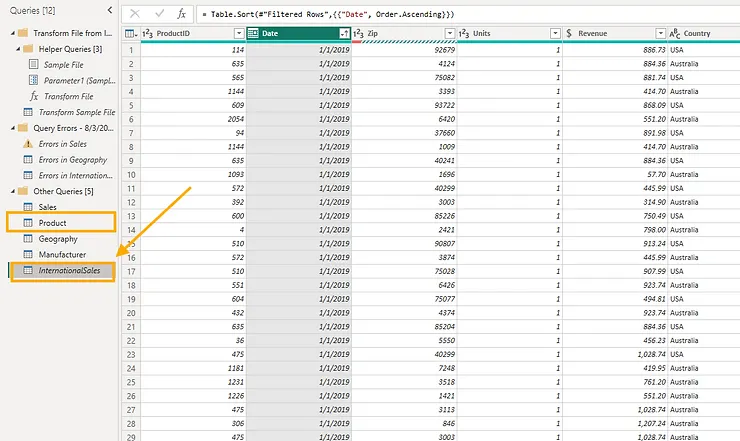
How to combine two dataset? (ex: sales + international sales)
[Home] > [Append Queries]
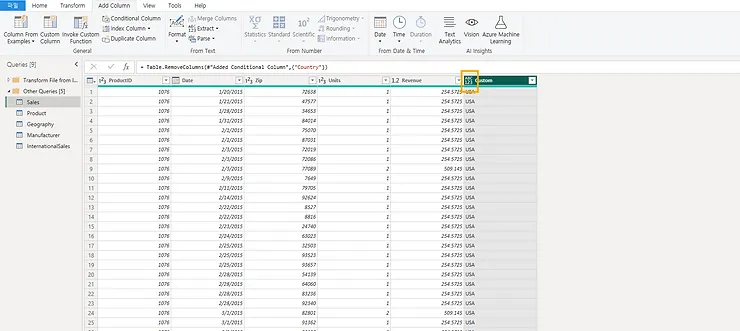
[Add Column] > [Conditional Column]
•
Do not forget to put certain things in 'Else' as well
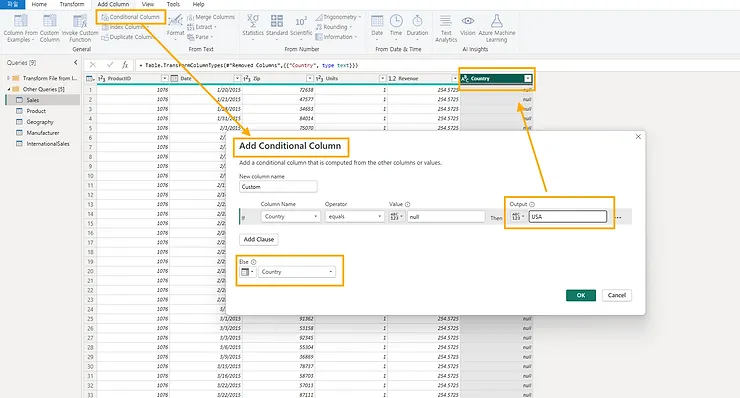
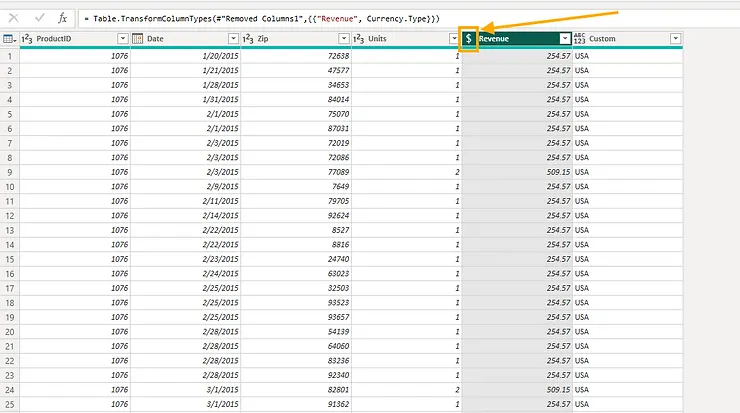
•
Change the country data-type to text
•
Change the revenue data-type to fixed decimal number
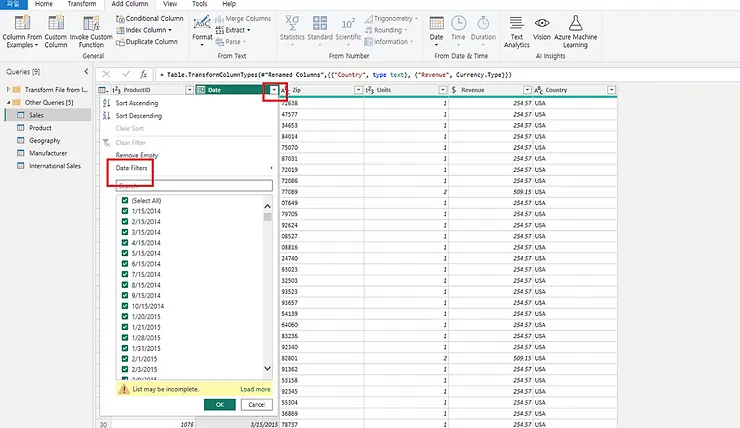
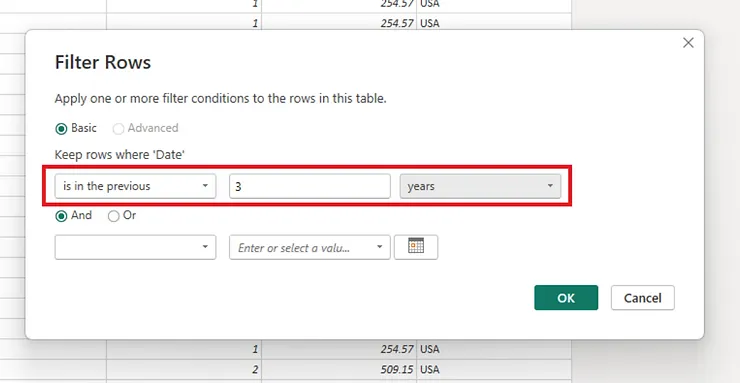
How do I filter specific periods of time in powerquery?
Don't forget to disable loading of unncessary dataset
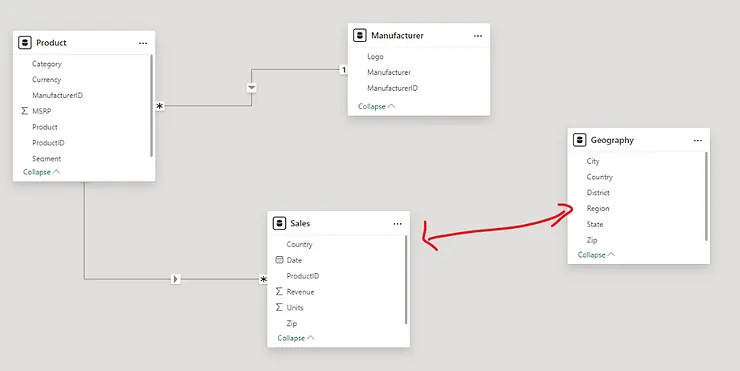
Data Modeling:
Why the chart doesn't display the data correctly?
This happens when no proper relationship has been created
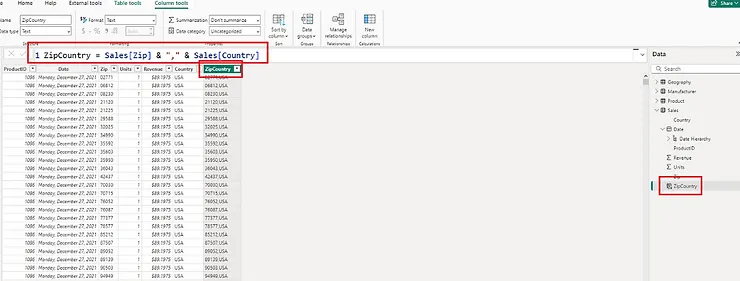
To resolve, you need to create unique identifier
[New Column]
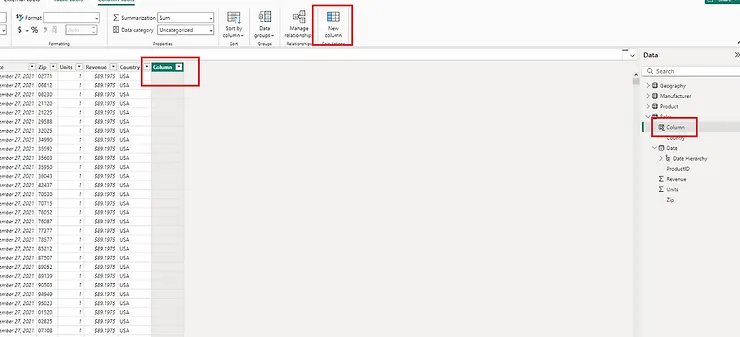
Use DAX to create new column
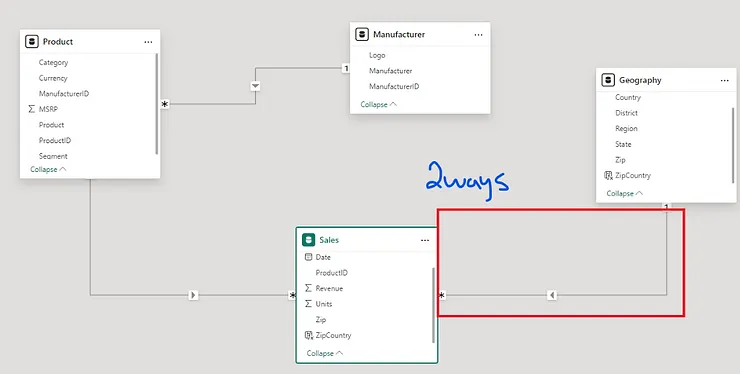
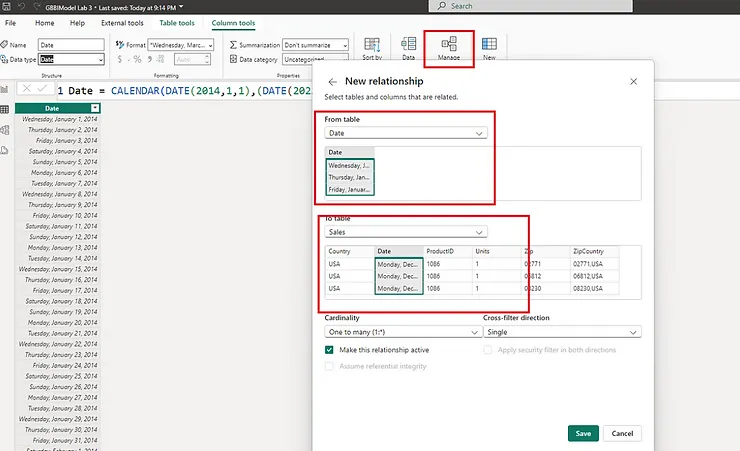
There are two ways to create relationships
1. Drag and Create
2. [Home] > [Manage Relationships]
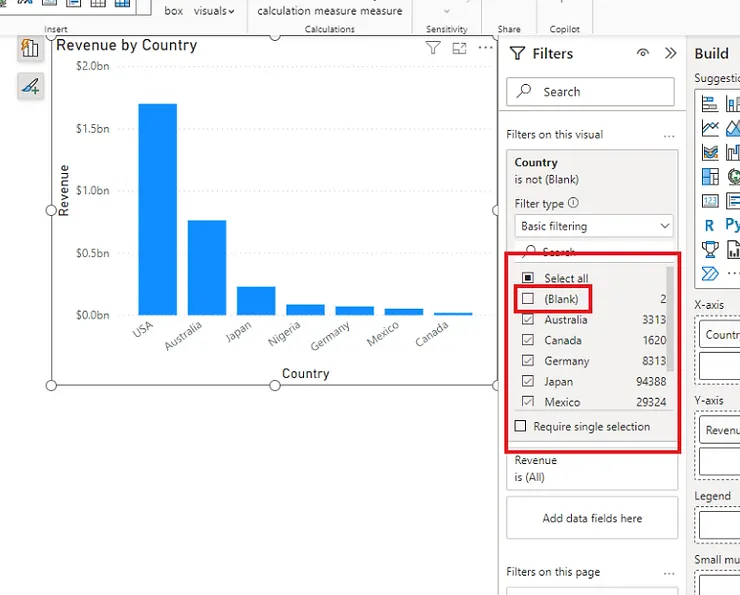
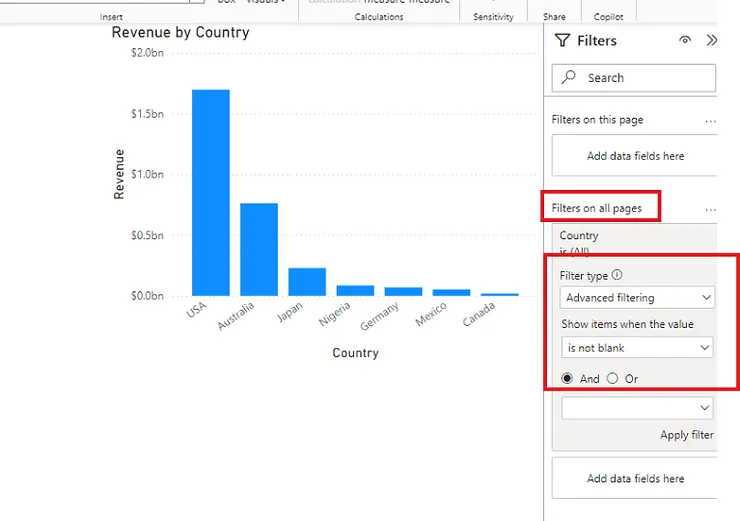
Make sure to filter out unnecessary data
1. Either filter on the viz
2. Filter as the whole canvas
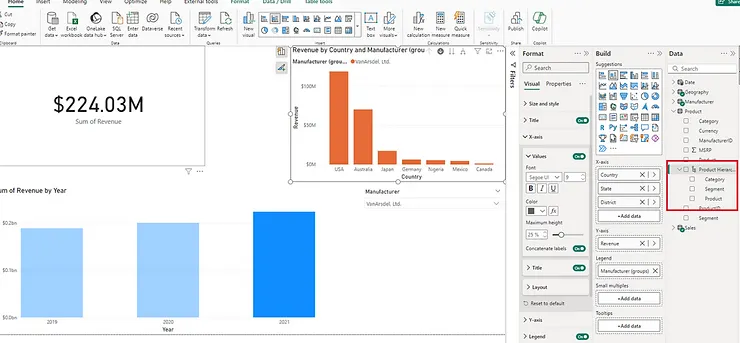
How can I only display Top 5 Competitors instead of all?
1. You can use filtering on every chart
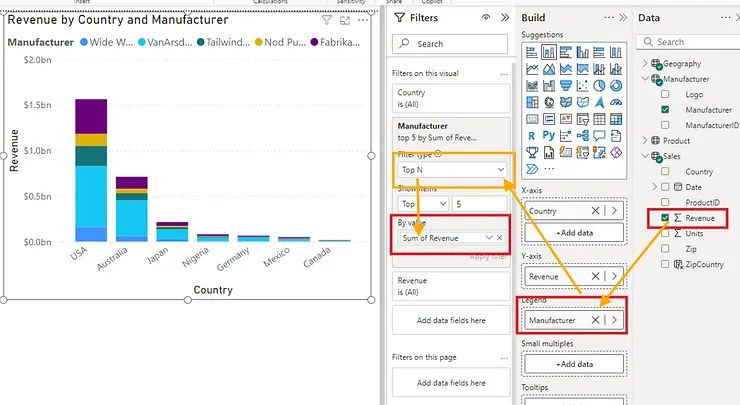
2. Instead do 'grouping'
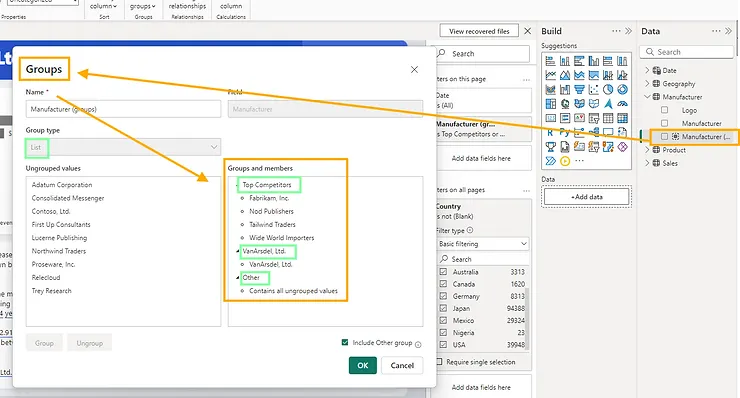
Apply the newly created group as page filter
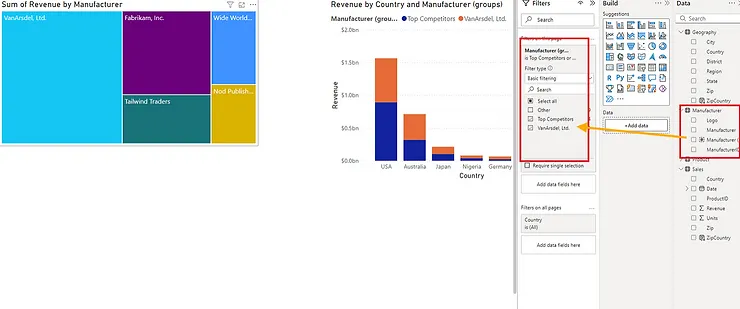
Make sure to add relevant interactions (I prefer filter which seems more organized instead of highlight)
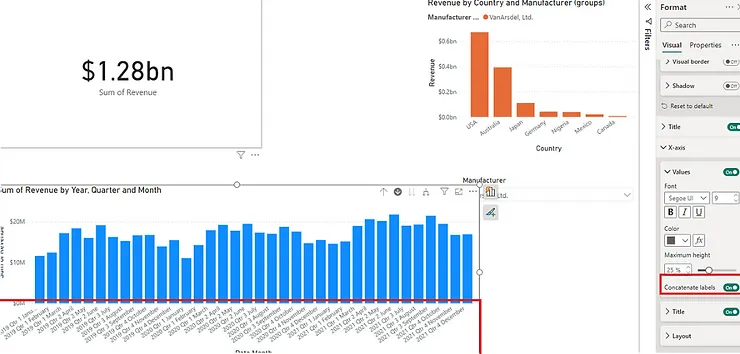
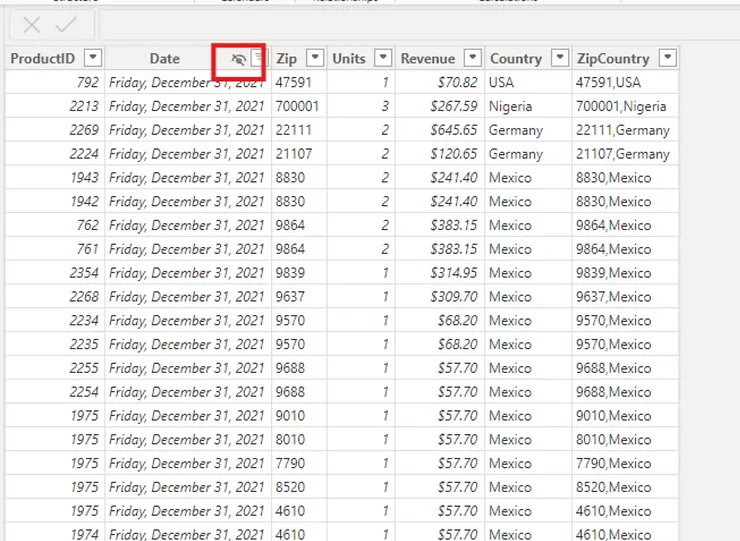
What is this option called?
This is called [Concentenate lables]
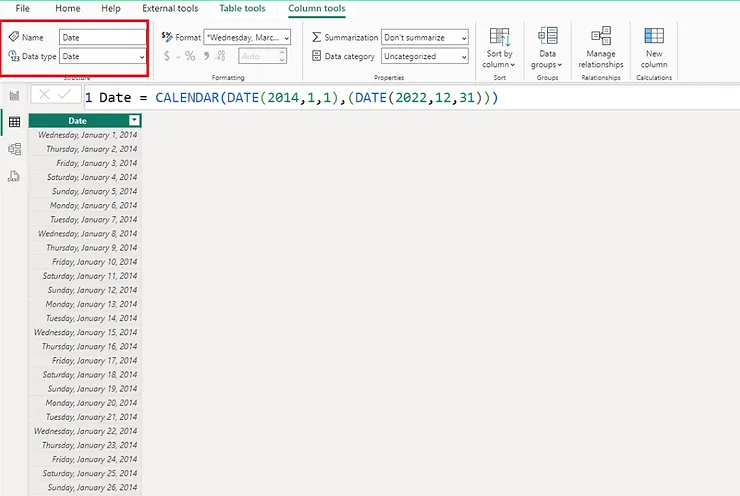
Create a date table in [Sales] Query so that you can create relationship with [Date] Table
•
Use DAX(Calendar) function
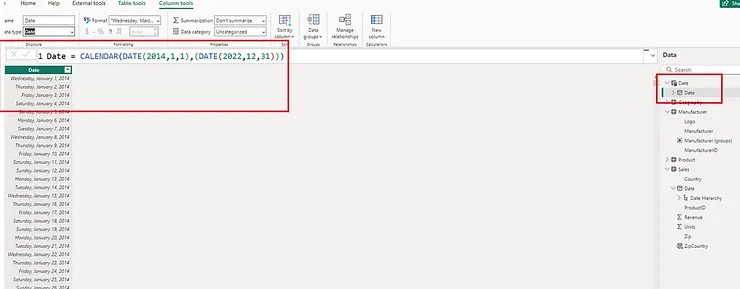
Change the data type to date (get rid of minutes)
Hide the unnecessary tables
Create product hierarchy
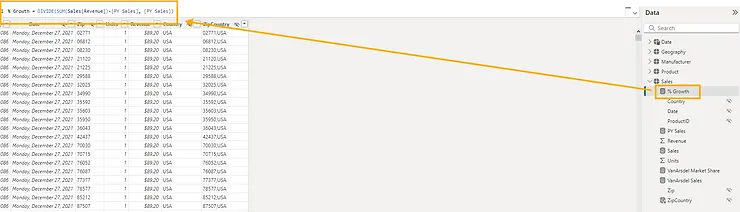
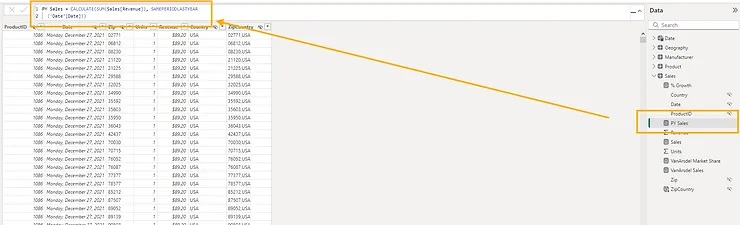
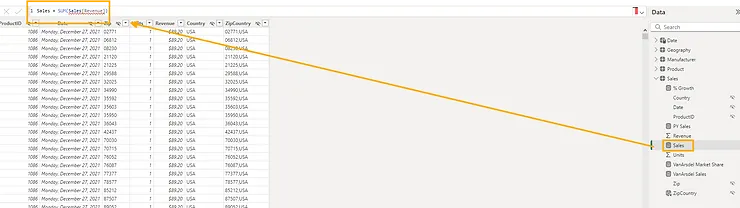
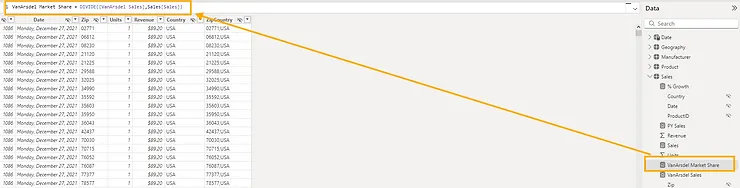
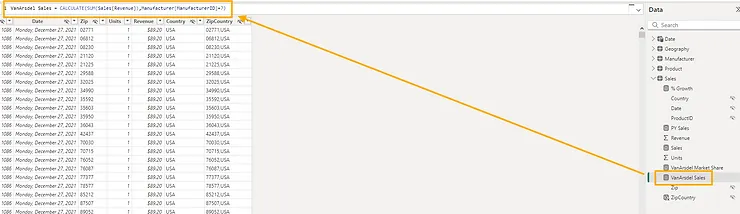
Create 'new measures' to enhance the calculation
% Growth = DIVIDE(SUM(Sales[Revenue])-[PY Sales], [PY Sales])
PY Sales = CALCULATE(SUM(Sales[Revenue]), SAMEPERIODLASTYEAR
('Date'[Date]))
Sales = SUM(Sales[Revenue])
VanArsdel Market Share = DIVIDE([VanArsdel Sales],Sales[Sales])
VanArsdel Sales = CALCULATE(SUM(Sales[Revenue]),Manufacturer[ManufacturerID]=7)
Data Analysis:
Insights:
•
VanArsdel comprises over 48.55% over the market (almost by half)
•
VanArsdel recorded an average of 10.94% growth throughout 2017 ~ 2021
•
The revenue has been consistenly growing but there is high fluctuation of growth going through a high trended down during 2019 - 2020 and steepest incline most likely from COVID
•
The largest proportion of the sales come from USA and Australia.
•
The market in USA made up 52.73% of revenue ($500M).
•
The least profit was in Canada.
•
Moderation Product Segment grew significantly from 2017 to 2021 ($62M - $98M).
Solutions:
•
While it is taking the largest proportion of revenues across the world, the market in Canada is not dominant($5M and competitors are around $1-2M). As the country has more potential, VanArsdel may need to consider the localized strategies to upscale its sales in Canada.
•
VanArsdal's one of top competitor 'Wide World Importer' recorded the highest growth of 12.59%. VanArsdal will have to further check in which areas the growth is lagging and make relative strategies.
•
VanArsdal will have to check whether the growth rate is in the state of stagnation or not. The given data shows that the growth rate recovered back to 2018 which is before COVID happened.
•
However, there were other product segments that did not growth as much. On the other hand, the extreme product segment of 'Wide World Importer' grew significantly, which VanArsdel should be alerted with this and check the rationale behind.