

[Summary]
Insights | Solutions |
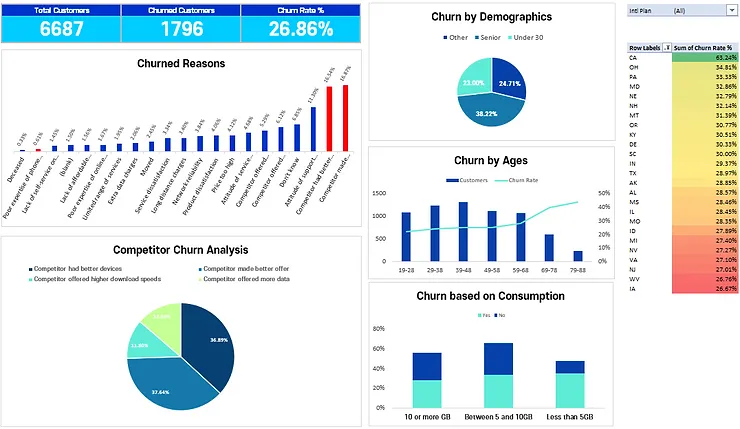
26.86% of the customers are churned. | Alert the issues of 26.86% of churn rate among the companies and conduct critical strategy analysis upon all departments: marketing, tech, services, policies, customer services
• Check whether the departments are fulfilling the KPIs and discover the room of improvement.
• Develop multiple strategies such as retooling the whole underperforming department |
Customers are majorly leaving because of competitors.
• The competitors tended to provide better devices and offers. | Initiate comprehensive competitor analysis and draft action plan based upon it. |
The seniors had the highest churn rate among the age groups. | Conduct surveys or design 1 on 1 interviews with seniors and find the pain points of Databel's service compared to competitors |
Having unlimited data plan and using less than 5GB have positive relationship of churn rate. | Calculate first whether dropping remedies to those who have unlimited plan but use less than 5GB will potentially decrease the churn rate and bring more profits. |
California recorded extraordinary amount of churn rate if customers have international activity. | Consider providing exclusive customer assistance to those who are using international plan in California and investigate underlying reasons of higher churn rate compared to other states. |
Introduction:
•
This case study is done upon the customer data of Databel, a telecom company in US.
•
The objective is to analyze the churn rate of Databel's customers, deliver extracted insights, and propose following solutions to the managers.
Context:
•
Databel that has been the market leader of the industry for years has a concern over its churn rate of the customers since the competition is more fierce than ever. On top of this, Databel wants to know the preferences of the customers deliver better service.
Exploratory Data Analysis
Data Cleaning:
Data Cleaning Checklist
1. Are the data's width and row allocated perfectly?
2. Are there any unnecessary names and words that need to be replaced?
3. Are there any disturbing capitalized data that needs to be in lower-case?
4. Is all the data organized being easy to read and analyze? (e.g. unnecessary spaces)
5. Is there any data that needs to be split?
6. Are there any duplicates?
7. Are there any blank cells?
8. Are there any error cell?
9. Is the header formatted well?
10. Turn and turn-off gridlines to see the data more clearly.
Exploring the data:
•
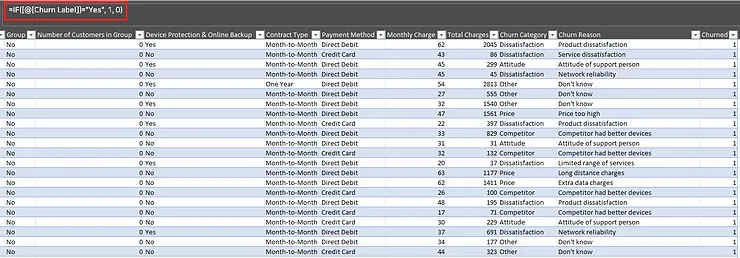
Calculate the churn rate of customers and add a new column for pivot chart
•
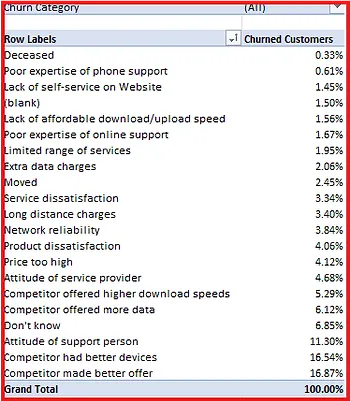
Investigate the churn reasons and display the results in percentile
•
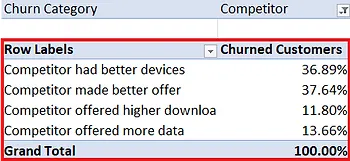
Categorize the churned reasons and discover the major reason of churning. Majority of the churned customers left because of competitors.
Data Analysis:
•
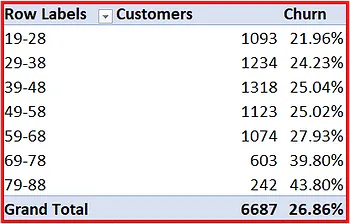
Find out which demographics have highest proportion of churn rate through adding new dataset (churned customers/total customers).
◦
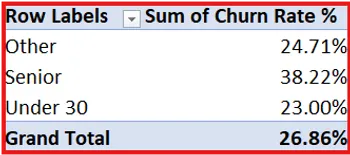
Although there seems to be higher churn rate among 59-88s, it is hard for us to see the difference clearly. Therefore categorize the ages into three groups of: 'Under 30', 'Senior', and 'Other.'
•
Now it is crystal clear that Senior group definitely has higher churn rate than other age groups.
•
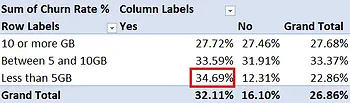
Check whether customers who are not in unlimited data plan are more likely to churn.
◦
It turns out that the customers who are in unlimited data plan using less than 5GB have the highest churn rate.
•
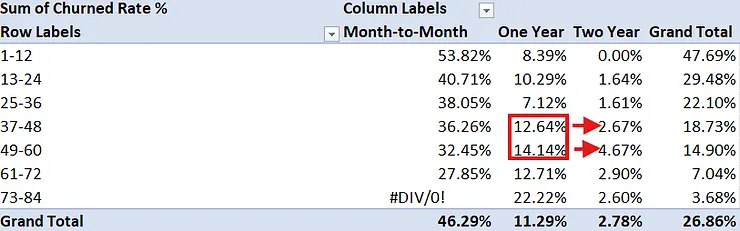
Check whether customer service of Databel is satisfying to see if customers are maintaining longer duration of contract.
◦
Customers who were in 37 - 48 months of contract have less two years contract compared to those in 49 - 60 months of contract.
◦
Customers who were in 13 - 24 months contract had the least one year contract rate.
•
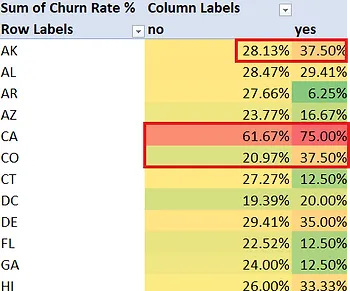
Check whether there is any relationship between doing international activity affects churn rate.
◦
There were some states that doing international activity affects the churn rate.
Visualization & Dashboarding:

Insights:
•
26.86% of the customers are churned.
•
Customers are majorly leaving because of competitors.
◦
The competitors tended to provide better devices and offers.
•
The seniors had the highest churn rate among the age groups.
•
Having unlimited data plan and using less than 5GB have positive relationship of churn rate.
•
California recorded extraordinary amount of churn rate if customers have international activity.
Solutions:
•
Alert the issues of 26.86% of churn rate among the companies and conduct critical strategy analysis upon all departments: marketing, tech, services, policies, customer services
◦
Check whether the departments are fulfilling the KPIs and discover the room of improvement.
◦
Develop multiple strategies such as retooling the whole underperforming department
•
Initiate comprehensive competitor analysis and draft case studies of selling points of competitors.
•
Conduct surveys or design 1 on 1 interviews with seniors and find the pain points of Databel's service compared to competitors
•
Calculate first whether dropping remedies to those who have unlimited plan but use less than 5GB will potentially decrease the churn rate and bring more profits.
•
Consider providing exclusive customer assistance to those who are using international plan in California and investigate underlying reasons of higher churn rate compared to other states.